This post is part 3 of 3 in a series on monitoring scalability.
In parts 1 and 2 of this series I talked about check latency and how you can mitigate its effects by splitting data collection + storage out from alerting, while looking at monitoring systems through the prism of an MVC web application.
This final post in the series provides a concrete example of how to instrument your monitoring checks so you can identify which exact parts of your checks are inducing latency in your monitoring system.
When debugging performance bottlenecks, I tend to use a simple but effective workflow:
- observe the system
- analyse the results
- optimise the bottleneck that is having the most impact
- rinse and repeat until the system is performing within the expected performance parameters
What if we continue to look at monitoring checks as micro MVC web applications? What tools exist to aid this optimisation workflow, and how can we hook instrumentation into our checks?
The crème de la crème of web app performance monitoring + optimisation tools is New Relic, boasting an incredibly rich feature set that lets you drill down deep into your application while also providing a high level view of app-wide performance.
But is it possible to hook New Relic into applications that aren’t web apps? Let’s give it a go.
Here’s an example monitoring check:
#!/usr/bin/env ruby
#
# Usage: check.rb <time>

class Check
  attr_reader :opts

  def initialize(opts={})
    @opts = opts
  end

  def model(opts={}
    i = opts[:time]
    sleep(1)
    raise [Exception, RuntimeError, StandardError][rand(2)] if rand(i) == 1
    return i
  end

  def view(data)
    i = data
    sleep(rand(i) / 5)
    raise [Exception, RuntimeError, ArgumentError][rand(2)] if rand(i) == 2

    puts "OK: we made it!"
  end

  def run
    data = model(@opts)
    view(data)
  end
end

Check.new(:time => ARGV[0].to_i).run
As you can see, it’s flat out like a lizard drinking inducing latency by sleeping and spicing things up by randomly throwing exceptions. All things considered, it’s actually a pretty good example of a monitoring check that aims to misbehave.
Let’s start instrumenting!
First up we need to load some libraries:
#!/usr/bin/env ruby

require 'rubygems'
require 'newrelic_rpm'

class Check
  include NewRelic::Agent::Instrumentation::ControllerInstrumentation
Reading through the New Relic API documentation…
# When the app environment loads, so does the Agent. However, the
# Agent will only connect to the service if a web front-end is found. If
# you want to selectively monitor ruby processes that don't use
# web plugins, then call this method in your code and the Agent
# will fire up and start reporting to the service.
…it looks like we need to manually start up the agent:
class Check
  # ...
end

NewRelic::Agent.manual_start
Now we need to tell the New Relic agent what to instrument. The API provides methods to do this at the transaction and method level:
class Check
  # ...

  add_transaction_tracer :run,   :name => 'run', :class_name => '#{self.class}'
  add_method_tracer      :model, 'Nagios/#{self.class.name}/model'
  add_method_tracer      :view,  'Nagios/#{self.class.name}/view'
end
In New Relic parlance, a transaction is an end-to-end process that is comprised of many smaller units of work, and a method is an individual unit of work. In this monitoring check scenario, a transaction is an invocation of the check.
When using the New Relic agent with Rails, by default it captures the query parameters passed to the controller action. This helps massively when debugging why a certain transaction takes longer to complete on particular inputs.
Wouldn’t it be cool if we could treat the command line arguments to the monitoring check as query parameters to the controller action? That way we could identify which services are running slowly and holding up the check.
Turns out this is just another option to add_transaction_tracer:
add_transaction_tracer :run, :name => 'run', :class_name => '#{self.class}', :params => 'self.opts'Provided you store all your options in an instance variable with an attr_reader, you can capture whatever data is passed to the check on execution.
One piece of data the New Relic agent captures is an Apdex score for each request. An Apdex score is a measurement of user satisfaction when interacting with an application or service.
In this particular scenario, the “user” is actually a monitoring system, so the score may not be that meaningful. Let’s disable it for now:
class Check
  # ...

  newrelic_ignore_apdex
end
So far everything has been very smooth - we’ve taken an existing check and added some instrumentation points with New Relic - but we’re about to hit a complication.
Internally the New Relic agent spawns a separate thread from which it sends all this instrumented data to the New Relic service. Establishing a connection to the New Relic service actually takes a while (15+ seconds in the worst cases), which doesn’t quite fit the paradigm we’re working in where monitoring checks are returning sub-second results.
Essentially this means that we’re collecting all this interesting data with the New Relic agent but it’s never actually sent to the New Relic service.
In the PHP world this is a very real problem as PHP processes will exit at the end of each request. In the PHP edition of New Relic there’s quite a cute workaround for exactly this problem - each PHP process sends data to a daemon running in the background that buffers it and sends it to New Relic at a regular interval.
Let’s emulate this functionality in Ruby:
at_exit do
  NewRelic::Agent.save_data
end
This will serialise the captured data to log/newrelic_agent_store.db as a marshalled Ruby object. The last step is to send this data to New Relic at a regular interval:
#!/usr/bin/env ruby
#
# Usage: collector.rb
#

require 'rubygems'
require 'newrelic_rpm'

module NewRelic
  module Agent
    def self.connected?
      agent.connected?
    end
  end
end

$stdout.sync = true
NewRelic::Agent.manual_start

print "Waiting to connect to the NewRelic service"
until NewRelic::Agent.connected? do
  print '.'
  sleep 1
end
puts

NewRelic::Agent.load_data
NewRelic::Agent.shutdown(:force_send => true)
This waits for the New Relic agent to establish a connection to the New Relic service, loads the data serialised by the checks, and sends it to New Relic.
Just for testing, we can run our pseudo collector like this:
while true; do echo "Sending" && ruby send.rb && echo "Sleeping 30" && sleep 30 ; doneAnd invoke the monitoring check like this:
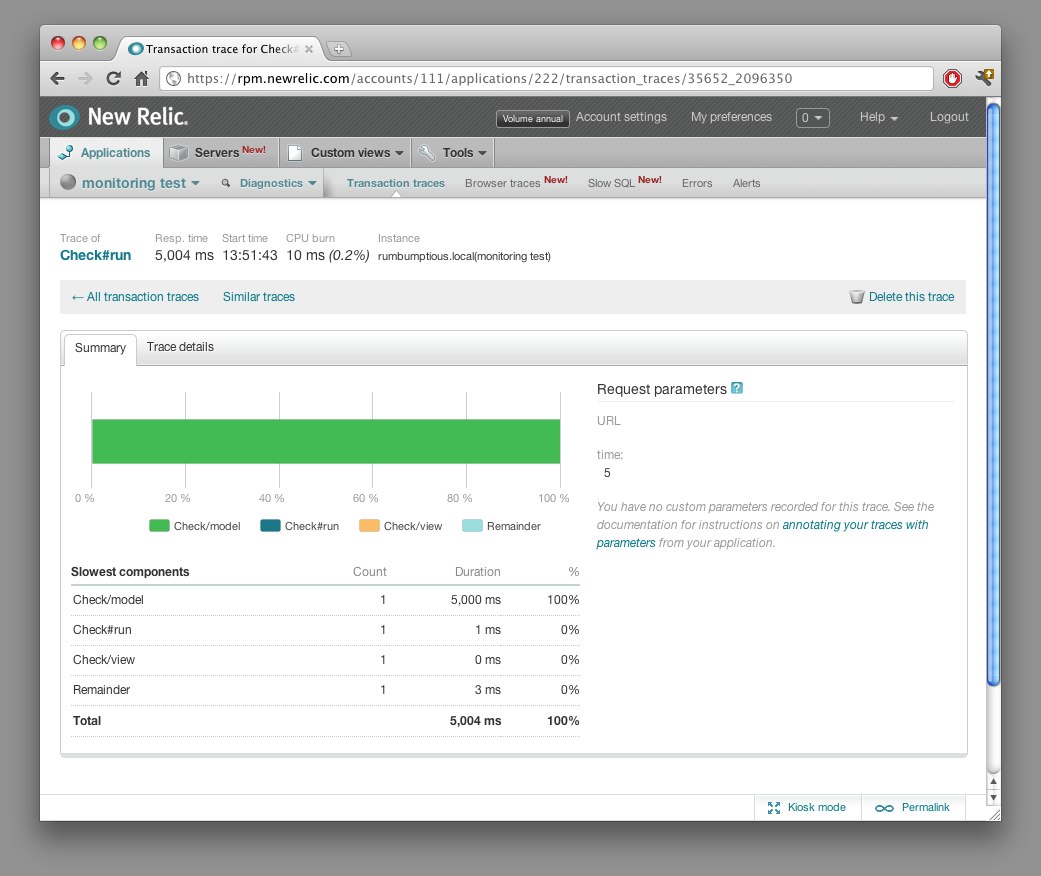
while true ; do RACK_ENV=development bundle exec ruby main.rb 5 ; doneNow we’ve got all this set up, we can log into New Relic to view some pretty visualisations of our monitoring check latency:

New Relic automatically identifies which transactions are the slowest, and lets you deep dive to identify where the slowness is:
If you haven’t got a brass razoo there are plenty of Open Source alternatives to New Relic, but you’ll have to do a bit more grunt work to get them going.
This post concludes this series on monitoring scalability! The TL;DR series summary:
- Check latency is the monitoring system killer.
- Even in simple environments check latency slows down your monitoring system and obfuscates incidents.
- To eliminate latency, separate data collection from alerting.
- Make your monitoring checks as non-blocking as possible.
- Whenever debugging monitoring performance problems, think of your monitoring system as an MVC web app.
- Instrument your monitoring checks to identify sources of latency.
You can find the above code examples on GitHub.
If you’ve enjoyed this series of posts, you can find more of my keen insights, witty banter, and Australian colloquialisms on Twitter, or subscribe to my blog.
