This post is part 2 of 3 in a series on monitoring scalability.
In part 1 of this series I talked about check latency, and how it can batter you operationally if it gets out of hand.
In this post I’m going to propose an alternative way of looking at monitoring systems that can hopefully shed light on some typical performance bottlenecks.
Architecturally, monitoring systems and web applications share many of the same design characteristics:
- A check is a request to an action on a controller
- Actions fetch data from a model, and expose a result through a view
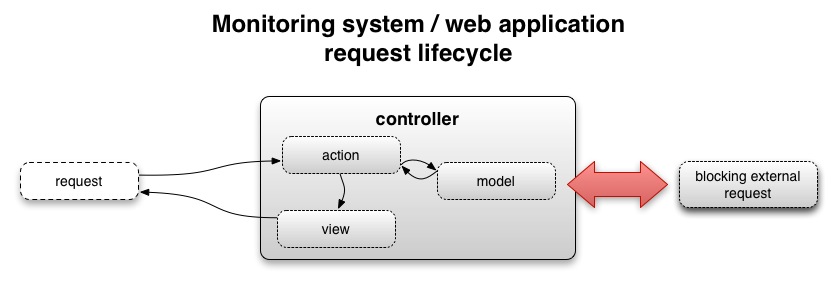
If you look at monitoring systems through this prism, many monitoring performance and scalability problems become simpler to understand:
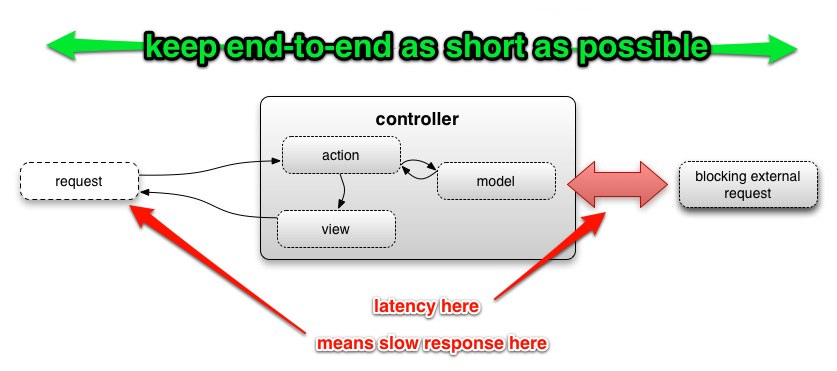
- Poorly optimised actions can take a variable amount of time to return a response
- You get the best performance out of your monitoring system by optimising actions that are slow, and working towards a consistent throughput across all your monitoring checks
Bearing this in mind, what methodologies do we use to remove performance bottlenecks from a web application? Can we apply those same techniques to monitoring systems?
One very common technique is to precompile data to eliminate computationally expensive operations when serving up a result. The precompilation should almost always be a separate process from the main process serving requests.
This has multiple benefits:
- You shift the computationally expensive and latency inducing work in a monitoring check to a separate process. This makes acheiving a low and consistent monitoring check response time vastly easier.
- You can throw specialisied hardware at particular parts of the monitoring pipeline. For example, use a SAN with a huge memory cache or SSDs exclusively in your data storage layer to speed up reads + writes, and beefy multicore machines in your alerting layer to increase your check parallelism.
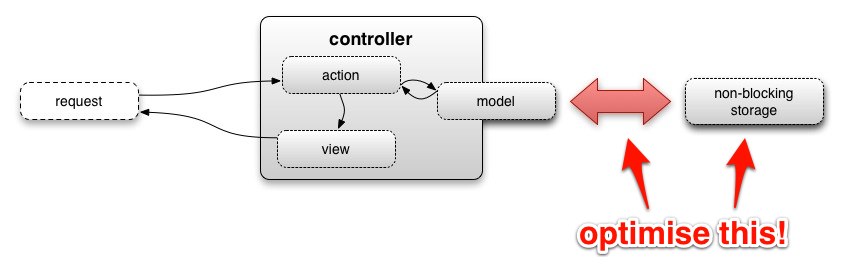
Separating data collection + storage from thresholding + notifications is the most crucial part of ensuring consistent check throughput in your monitoring system
In September of 2011 Stephen Nelson-Smith covered why this separation is so important in his article We alert on what we draw. The article can be boiled down to “Your graphs and your alerts should be created from the same data source. This simplifies incident response and analysis.”
The other advantage that Stephen didn’t cover was the massive throughput boost this gives your monitoring system. It’s tempting to say that the throughput boost is a bigger advantage than the operational gains, however the two are inextricably linked. You have massive operational issues if your monitoring system is “running late” on executing monitoring checks, but you’ve got Buckley’s chance of effectively responding to incidents if you have no visibility of those incidents.
My preference is to collect + store the data with collectd + OpenTSDB, however the DevOps community as a whole seems to be very keen on Ganglia + Graphite. YMMV, do your research and use what’s best for you.
The most time consuming part of adopting this separation strategy is reworking your monitoring checks to fetch from these data stores. I’d highly recommend writing a small DSL for doing common things like fetching data and comparing results.
No approach is perfect, and separating your data from your alerting introduces a different set of problems.
Even by separating the collection from the alerting, your monitoring checks are still essentially going to block when retrieving data from your storage layer. Keeping in mind you will never be able to truly eliminate blocking checks, it is imperative you ensure these new checks block as little as possible, otherwise you’ll be subjecting yourself to the same problems.
Write your checks with the expectation that your data store will become unreachable. The biggest drawback to separation is that when your data store becomes unreachable, all of your checks will fail simultaneously.
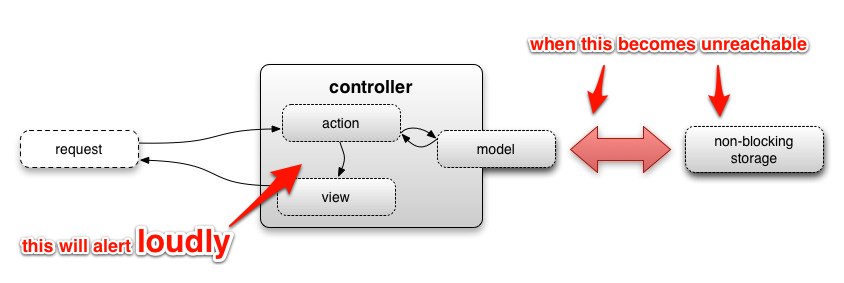
Operationally this can be a complete nightmare. I have seen many a pager and mobile phone melt under a deluge of notifications saying that data for a check could not be read.
There are two workarounds for this problem:
- Set up a parent check for all your monitoring checks that simply reads a value out of the data store, and goes critical if the data store can’t be accessed. If your monitoring system does parenting properly and you have a good check throughput, this should minimise the explosion of alerts.
- Build a manual or automatic notification kill switch into your monitoring system so if the shit does hit the fan and your storage layer disappears, you don’t suffer from information overload and do something fatally stupid.
So how do you ensure your monitoring checks aren’t suffering from check latency?
In the next post in this series, we’ll look at instrumenting your monitoring checks themselves to identify which parts of the checks have bottlenecks.
