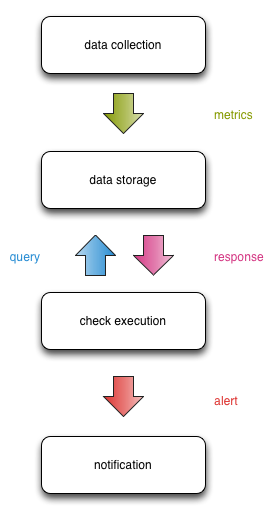
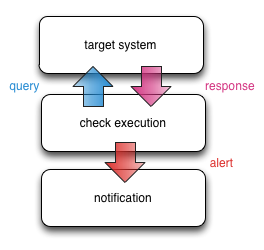
To recap, pipelines are a useful way of modelling monitoring systems.
Each compartment of the pipeline manipulates monitoring data before making it available to the next.
At a high level, this is how data flows between the compartments:

This design gives us a nice separation of concern that enables scalability, fault tolerance, and clear interfaces.
The problem
What happens when there is no data available for the checks to query?
In this very concrete case, we can divide the problem into two distinct classes of failure:
- Latency when accessing the metric storage layer, manifested as checks timing out.
- Latency or failure when pushing metrics into the storage layer, manifested as checks being unable to retrieve fresh data.
There are two outcomes from this:
- We need to provide clearer feedback to the people responding to alerts, to give them more insight into what’s happening within the pipeline
- We need to make the technical system more robust when dealing with either of the above cases
Alerting severity levels aren’t granular or accurate in a modern monitoring context
There are entire classes of monitoring problems (like the one we’re dealing with here) that map poorly into the existing levels. This is an artefact of an industry wide cargo culting of the alerting levels from Nagios, and these levels may not make sense in a modern monitoring pipeline with distinctly compartmentalised stages.
For example, the Nagios plugin development guidelines state that UNKNOWN from a check can mean:
- Invalid command line arguments were supplied to the plugin
- Low-level failures internal to the plugin (such as unable to fork, or open a tcp socket) that prevent it from performing the specified operation.
“Low-level failures” is extremely broad, and it’s important operationally to provide precise feedback to the people maintaining the monitoring system.
Adding an additional level (or levels) with contextual debugging information would help close this feedback loop.
In defence of the current practice, there are operational benefits to mapping problems into just 4 levels. For example, there are only ever 4 levels that an engineer needs to be aware of, as opposed to a system where there are 5 or 10 different levels that capture the nuance of a state, but engineers don’t understand what that nuance actually is.
Compartmentalisation as the saviour and bane
The core idea driving the pipeline approach is compartmentalisation. We want to split out the different functions of monitoring into separate reliable compartments that have clearly defined interfaces.
The motivation for this approach comes from the performance limitations of traditional monitoring systems where all the functions essentially live on a single box that can only be scaled vertically. Eventually you will reach the vertical limit of hardware capacity.
This is bad.

Thus the pipeline approach:
Each stage of the pipeline is handled by a different compartment of monitoring infrastructure that analyses and manipulates the data before deciding whether to pass it onto the next compartment.
This sounds great, except that now we have to deal with the relationships between each compartment both in the normal mode of operation (fetching metrics, querying metrics, sending notifications, etc), but during failure scenarios (one or more compartments being down, incorrect or delayed information passed between compartments, etc).
The pipeline attempts to take this into account:
Ideally, failures and scalability bottlenecks are compartmentalised.
Where there are cascading failures that can’t be contained, safeguards can be implemented in the surrounding compartments to dampen the effects.
For example, if the data storage infrastructure stops returning data, this causes the check infrastructure to return false negatives. Or false positives. Or false UNKNOWNs. Bad times.
We can contain the effects in the event processing infrastructure by detecting a mass failure and only sending out a small number of targeted notifications, rather than sending out alerts for each individual failing check.
While the design is in theory meant to allow this containment, the practicalities of doing this are not straightforward.
Some simple questions that need to be asked of each compartment:
- How does the compartment deal with a response it hasn’t seen before?
- What is the adaptive capacity of each compartment? How robust is each compartment?
- Does a failure in one compartment cascade into another? How far?
The initial answers won’t be pretty, and the solutions won’t be simple (ideal as that would be) or easily discovered.
Additionally, the robustness of each compartments in the pipeline will be different, so making each compartent fault tolerant is a hard slog with unique challenges in each compartment.
How are people solving this problem?
Netflix recently open sourced a project called Hystrix:
Hystrix is a latency and fault tolerance library designed to isolate points of access to remote systems, services and 3rd party libraries, stop cascading failure and enable resilience in complex distributed systems where failure is inevitable.
Specifically, Netflix talk about how they make this happen:
How does Hystrix accomplish this?
- Wrap all calls to external systems (dependencies) in a HystrixCommand object (command pattern) which typically executes within a separate thread.
- Time-out calls that take longer than defined thresholds. A default exists but for most dependencies is custom-set via properties to be just slightly higher than the measured 99.5th percentile performance for each dependency.
- Maintain a small thread-pool (or semaphore) for each dependency and if it becomes full commands will be immediately rejected instead of queued up.
- Measure success, failures (exceptions thrown by client), timeouts, and thread rejections.
- Trip a circuit-breaker automatically or manually to stop all requests to that service for a period of time if error percentage passes a threshold.
- Perform fallback logic when a request fails, is rejected, timed-out or short-circuited.
- Monitor metrics and configuration change in near real-time.
Potential Solutions
We can apply many of the strategies from Hystrix to the monitoring pipeline:
- Wrap all monitoring checks with a timeout that returns an
UNKNOWN(assuming you stick with the existing severity levels) - Add some sort of signalling mechanism to the checks so they fail faster, e.g.
- Stick a load balancer like HAProxy or Nginx in front of the data storage compartment
- Cache the state of the data storage compartment that all monitoring checks check before querying the compartment
- Detect mass failures, and notify on-call and the monitoring system owners directly to shorten the MTTR. This is something Flapjack aims to do as part of the reboot.
I don’t profess to have all (or even any) of the answers. This is new ground, and I’m very curious to hear how other people are solving this problem.