Over the last few years I have been experimenting with different approaches for scaling systems that monitor large numbers of heterogenous hosts, specifically in hosting environments.
This post outlines a pipeline approach for modelling and manipulating monitoring data.
Monitoring can be represented as a pipeline which data flows through, and is eventually turned into a notification for a human.
This approach has several benefits:
- Failures are compartmentalised
- Compartments can be scaled independently from one another
- Clear interfaces are required between compartments, enabling composability
Each stage of the pipeline is handled by a different compartment of monitoring infrastructure that analyses and manipulates the data before deciding whether to pass it onto the next compartment.
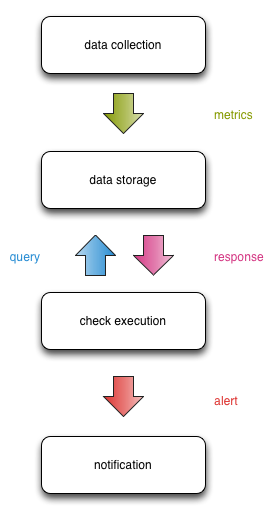
These components are the bare minimum required for a monitoring pipeline:
-
Data collection infrastructure, is generally a collection of agents on target systems, or standalone tools that extract metrics from opaque systems (preferably via an API).
-
Data storage infrastructure, provides a place to push collected metrics. These metrics are almost always numerical. These metrics are then queried and fetched for graphing, monitoring checks, and reporting - thus enabling “We alert on what we draw”.
-
Check execution infrastructure, runs the monitoring checks that are configured for each host, that query the data storage infrastructure. Checks that query textual data often poll the target system directly, which can have effects on latency.
-
Notification infrastructure, processes check results from the check execution infrastructure to send notifications to engineers or stakeholders. Ideally the notification infrastructure can also feed back actions from engineers to acknowledge, escalate, or resolve alerts.
At a high level, this is how data flows between the compartments:
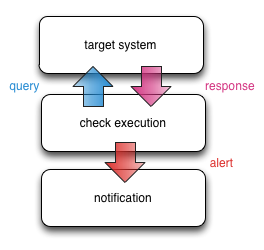
When using Nagios, the check + notification infrastructure are generally collapsed into one compartment (with the exception of NRPE).
Many monitoring pipelines start out with the data collection + storage infrastructure decoupled from the check infrastructure. Monitoring checks query the same targets that are being graphed, but:
- Because the check intervals don’t necessarily match up to the data collection intervals, it can be hard to correlate monitoring alerts to features on the graphs.
- The more systems poll the target system, the more the observer effect is amplified.
There are two other compartments that are becoming increasingly common:
-
Event processing infrastructure. Sitting between the check execution and notification infrastructure, this compartment processes events generated from the check infrastructure, identifies trends and emergent behaviours, and forwards the alerts to the notification infrastructure. It may also make decisions on who to send alerts to.
-
Management infrastructure, provides command + control facilities across all the compartments, as well as being the natural place for graphing and dashboards of metrics in the data storage infrastructure to live. If the target audience is non-technical or strongly segmented (e.g. many customers on a shared monitoring infrastructure), it can also provide an abstracted pretty public face to all the compartments.
This is how event processing + management fit into the pipeline:
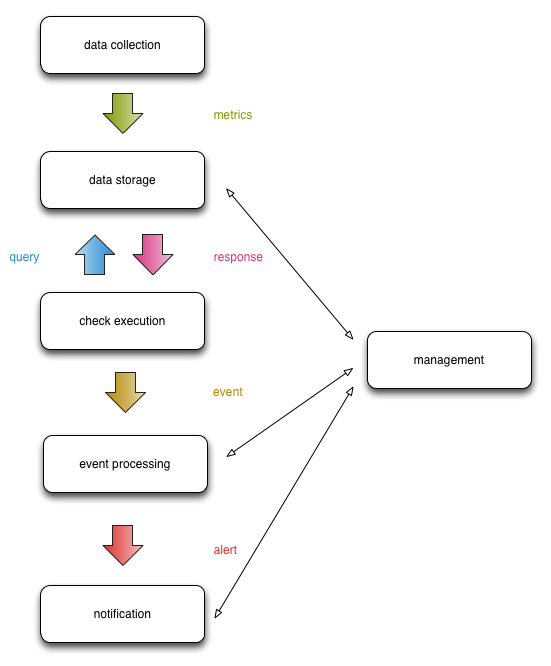
The management infrastructure can likely be broken up into different compartments as well, but for now it serves as a placeholder.
Let’s explore the benefits of this pipeline design.
Failures are compartmentalised
Ideally, failures and scalability bottlenecks are compartmentalised.
Where there are cascading failures that can’t be contained, safeguards can be implemented in the surrounding compartments to dampen the effects1.
For example, if the data storage infrastructure stops returning data, this causes the check infrastructure to return false negatives. Or false positives. Or false UNKNOWNs. Bad times.
We can contain the effects in the event processing infrastructure by detecting a mass failure and only sending out a small number of targeted notifications, rather than sending out alerts for each individual failing check.
This problem is tricky, interesting, and fodder for further blog posts. :-)
Compartments can be scaled independently
Monolithic monitoring architectures are a pain to scale. Viewing a monolithic architecture through the prism of the pipeline model, all of the compartments are squeezed onto a single machine. Quite often there isn’t a data collection or storage layer either.
Monolithic architectures often use the same moving parts under the hood, but they tend to be very closely entwined. Each tool has very distinct performance characteristics, but because they all run on a single machine and poorly separated, the only way to improve performance is by throwing expensive hardware at the problem.
If you’ve ever worked with a monolithic monitoring system, you will likely be experiencing painful flashbacks right about now.
To generalise the workload of the different compartments:
- Check execution, notifications, and event processing tends to be very CPU intensive + network latency sensitive
- Data storage is IO intensive + disk space expensive
Making sure each compartment is humming along nicely is super important when providing a consistent and reliable monitoring service.
Splitting the compartments onto separate infrastructure enables us to:
- Optimise the performance of each component individually, either through using hardware that’s more appropriate for the workloads (SSDs, multi-CPU physical machines), or tuning the software stack at the kernel and user space level.
- Expose data through well defined APIs, which leads into the next point:
Clear interfaces are required between compartments
I like to think of this as “the Duplo approach” - compartments with well defined interfaces you can plug together to compose your pipeline.

Clear interfaces abstract the tools used in each compartment of the pipeline, which is essential for chaining tools in a composable way.
Clear interfaces help us:
- Replace underperforming tools that have reached their scalability limits
- Test new tools in parallel with the old tools by verifying their inputs + outputs
- Better identify input that could be considered erroneous, and react appropriately
Concepts like Design by Contract, Service Oriented Architecture, or Defensive Programming then have direct applicability to the design of individual components and the pipeline overall.
It’s not all rainbows and unicorns. There are some downsides to the pipeline approach.
Greater Cost
There will almost certainly be a bigger initial investment in building a monitoring system with the pipeline approach.
You’ll be using more components, thus more servers, thus the cost is greater. While the cost of scaling out may be greater up-front, you limit the need to scale up later on.
You can counteract some of these effects by starting small and dividing up compartments over time as part of a piecemeal strategy, but this takes time + persistence.
I can tell you from personal project management experience when rolling out of this pipeline design that it’s hard work keeping a model of the complexity in your head and also well documented.
More Complexity
The pipeline makes it easier to eliminate scalability bottlenecks at the expense of more moving parts. The more moving parts, the greater the likelihood of failure.
Operationally it will be more difficult to troubleshoot when failures occur, and this becomes worse as you increase the safeguards and fault tolerance within your compartments.
This is the cost of scalability, and there is no easy fix.
Conclusion
The pipeline model maps nicely to existing monitoring infrastructures, but also to larger distributed monitoring systems.
It provides scalability, fault tolerance, and composability at the cost of a larger upfront investment.
1: This is a vast simplification of a very complex topic. Thinking of failure as an energy to be contained by barriers was a popular perspective in accident prevention circles from the 1960’s to the 1980’s, but the concept doesn’t necessarily apply to complex systems.
