I’ve been working on a cool little side project the last week called Visage. It renders graphs of collectd statistics in the browser, making the data interactive.
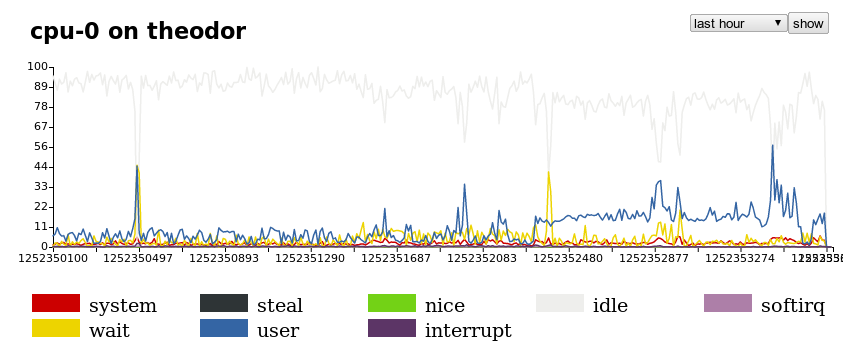
It’s a lot more interactive than the screenshot suggests, so check out an instance of Visage running.
Some background:
collectd is an awesome way to collect statistics from your Unix machines and aggregate the stats in one place (it has a network plugin that makes this a cinch).
So you set up collectd, and you’re getting all these great statistics, but you want graphs right? Graphs make the IT manager in all of us smile.
To date there have been two options for viewing graphs of collectd’s data: collection.cgi, which comes bundled with collectd on most distros, though sometimes squirreled away weirdly, and the newer collection3.
The problem I have with these interfaces is that they are organised like the RRDs that collectd stores. You basically use the interface to navigate the RRDs, not deduce meaning.
I want to easily see correlations between multiple hosts during a slashdotting. I want to view related stats for a host on a dashboard page. I want to filter out datasets that aren’t interesting to me.
What’s holding the existing graphing interfaces back is the presentation layer (graphs generated from RRDtool, wrapped in a smattering of Perl) being very tightly coupled with the data layer (the RRDs themselves).
So I set about exposing the RRDs in a more digestible form - JSON.
Once the RRDs are exposed over the web it makes it easy to consume the data and build your own graphing interface as either a thick client, Flash widget, or in the browser. You could also do periodic snapshots and reporting, but I digress.
So once I was able to consume this data, I used the Raphaël JavaScript library to render the graphs, and turned it into a MooTools class for maximum reusability.
So there you have it!
Right now there are a few rough edges (the axis labels keep me up at night), but it’s functional. If you give it a go, i’d like to know! You can report any issues you find on GitHub.
