This project had a very simple goal:
Display local weather measurements on old tablet in our kitchen.
I have:
- A first generation iPad mini that has been gathering dust since 2019.
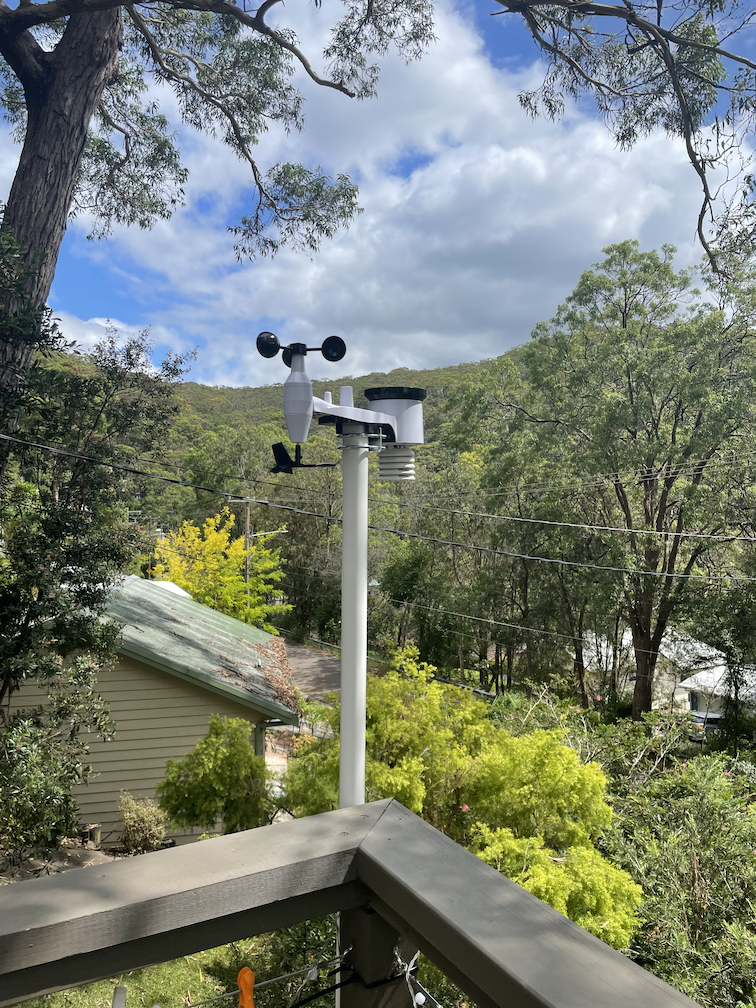
- An outdoor weather station:
- A Raspberry Pi with a DVB receiver:
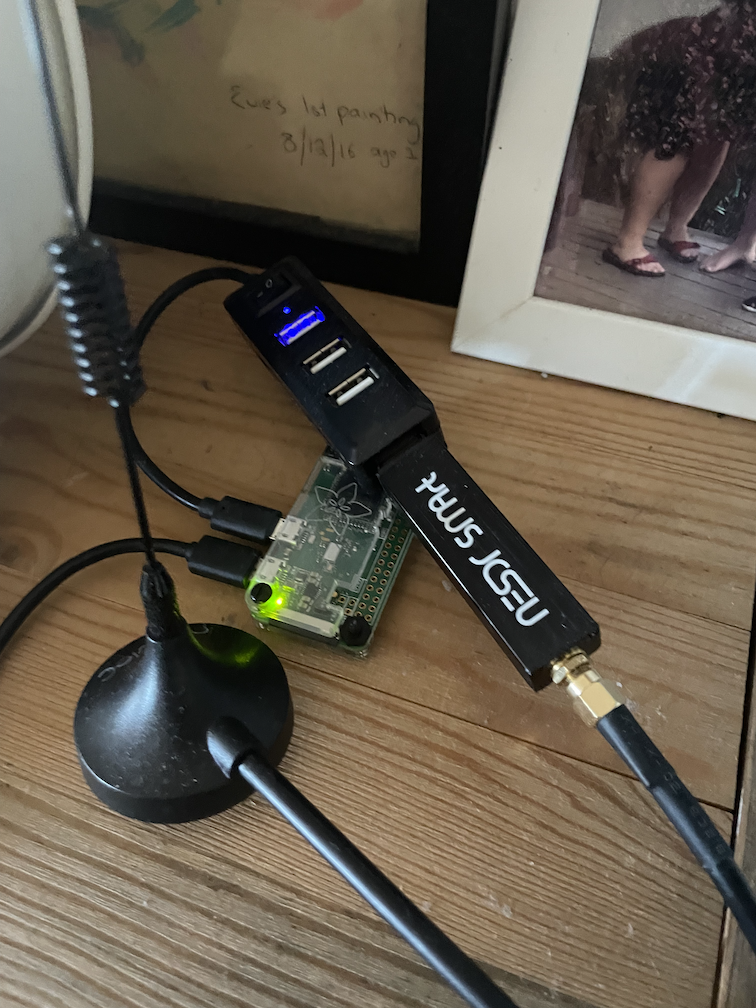
- And Grafana & Prometheus on a Vultr VPS that scrapes the Raspberry Pi.
There are obviously some resource constraints here — device and operating system age, memory limits — so it was interesting to solve this problem within these constraints.
Trial and error
First step after wiping the device was to try visiting the existing Grafana dashboards, to see if it would load. This failed immediately because the certificates had expired.
This uncovered the first problem: the device hasn’t received software updates since August 2016, and certificates issued by Let’s Encrypt no longer work.
Fortunately other people have dealt with this issue, back when the certs in the iOS trust store expired in 2021. This very helpful post on the Let’s Encrypt Community Support forum explains how to manually install the current Let’s Encrypt certs from https://letsencrypt.org/certs/isrgrootx1.pem.
With the certificates fixed, I tried visiting the existing graphs dashboard again, but now it showed a new error:
If you're seeing this Grafana has failed to load its application files
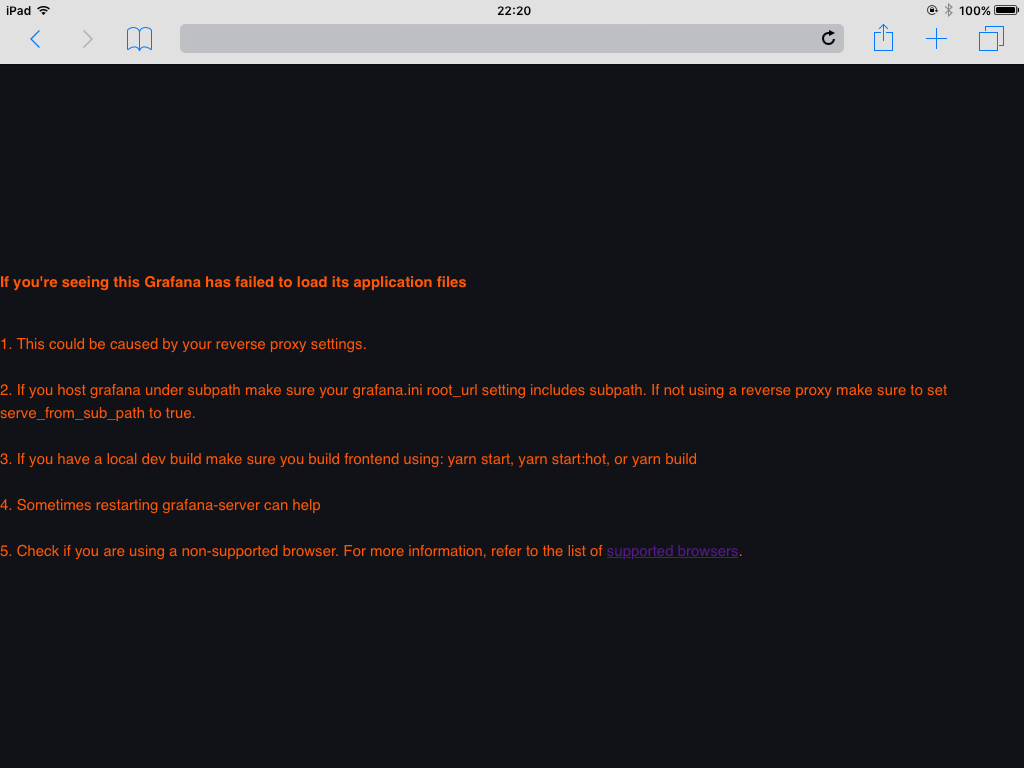
Not particularly helpful, especially when you don’t have access to Safari’s dev console on the iPad.
But! I was able to use ios-webkit-debug-proxy to show the errors on a desktop browser. This surfaced a bunch of JavaScript errors for unsupported browser features.
Based on this, I stumbled across this GitHub Issue that showed Grafana 7.0.6 was the last version that supported Safari shipped with iOS 9.3.
This left me with two choices.
Crazy or annoying: pick one
-
Keep using the latest Grafana, but use wrp (as suggested in this Reddit post) to render the page as an image.
This is a wild approach, and it was crazy enough that I had to try it.
While I kinda got it working, I found there were too many moving parts, and I quickly ran into memory limits on the VPS (it’s running a headless Chrome).
-
Set up a standalone instance of Grafana running 7.0.6, the last version that worked with iOS 9.3.5.
This had a few downsides:
- Grafana won’t be patched when there are bugs. To mitigate, I could use Nginx + basic auth to protect it from the public web.
- It’s a separate set of dashboards to maintain. I couldn’t export the dashboard from the newer Grafana and import into 7.0.6, because the dashboard schema had changed. So I would have to recreate dashboards manually, and some of the panel types (like the stat panel) have fewer features.
At the end of the day, option 2 was the least terrible, and the end users (my family) don’t need to know or care about how inelegant the setup is behind the scenes.
The last software thing to set up was Kiosk mode for iPad, to show the dashboard in full screen. Fortunately Kiosk mode still works on older iOS — thanks to the maintainers!
Finally, I had to safely mount the iPad to the wall. I used the Dockem Koala Mount 2.0, mounted directly into the stud:
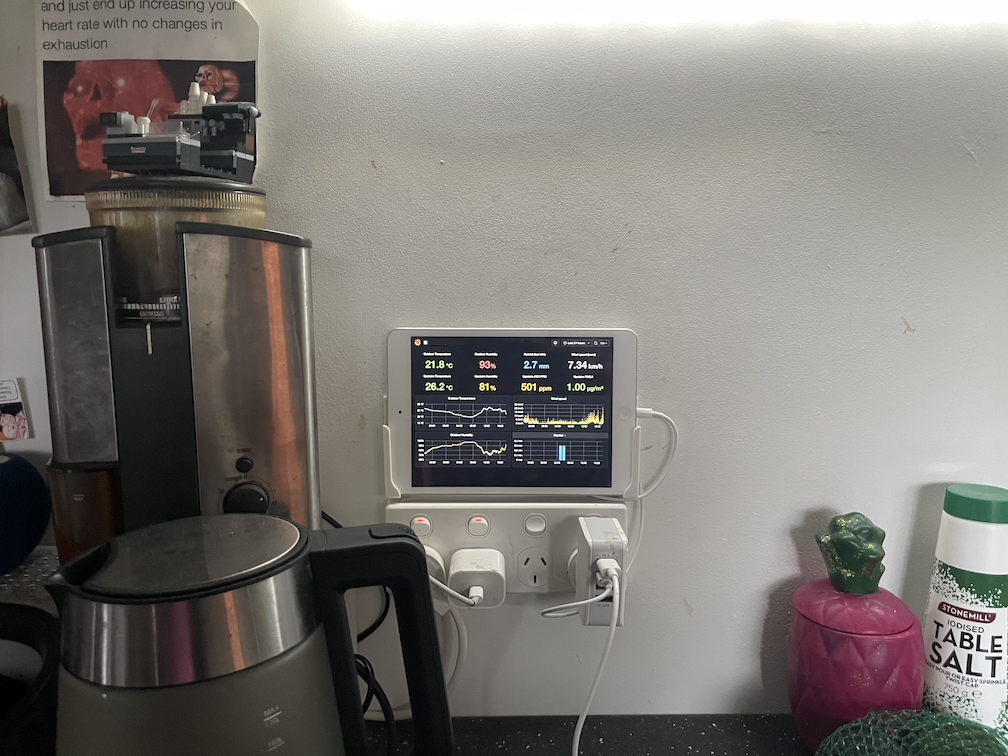
In conclusion, it’s still possible in 2024 to use older iPads with a bit of work. My recommendation is to stick to things in the browser, or use some of the few apps that still work on the first gen iPads.
