At my day job, I run a distributed team of infrastructure coders spread across Australia + one in Vietnam. Our team is called the Software team, but we’re more analogous to a product focused Research & Development team.
Other teams at Bulletproof are a mix of office and remote workers, but our team is a little unique in that we’re fully distributed. We do daily standups using Google Hangouts, and try to do face to face meetups every few months at Bulletproof’s offices in Sydney.
Intra-team communication is something we’re good at, but I’ve been putting a lot of effort lately into improving how our team communicates with others in the business.
This is a post I wrote on our internal company blog explaining how we schedule work, and why we work this way.
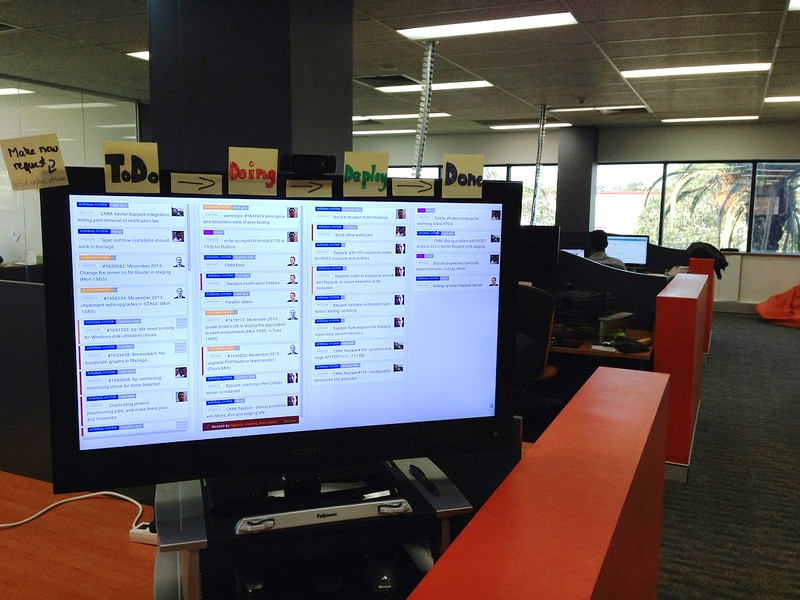
What on earth is this?
This is a Kanban board.
A Kanban board is a tool for implementing Kanban. Kanban is a scheduling system developed at Toyota in the 70’s as part of the broader Toyota Production System.
Applied to software development, the top three things Kanban aims to achieve are:
- Visualise the flow of work
- Limit the Work-In-Progress (WIP)
- Manage and optimise the flow of work
How does Kanban work for the Software team?
In practical terms, work tends to be tracked in:
- RT tickets, as created using the standard request process, or escalated from other teams
- GitHub issues, for product improvements, and work discovered while doing other work
- Ad-hoc requests, through informal communication channels (IM, email)
Because Software deals with requests from many audiences, we use a Kanban board to visualise work from request to completion across all these systems.
Managing flow
As of writing, we have 5 stages a task progresses through:
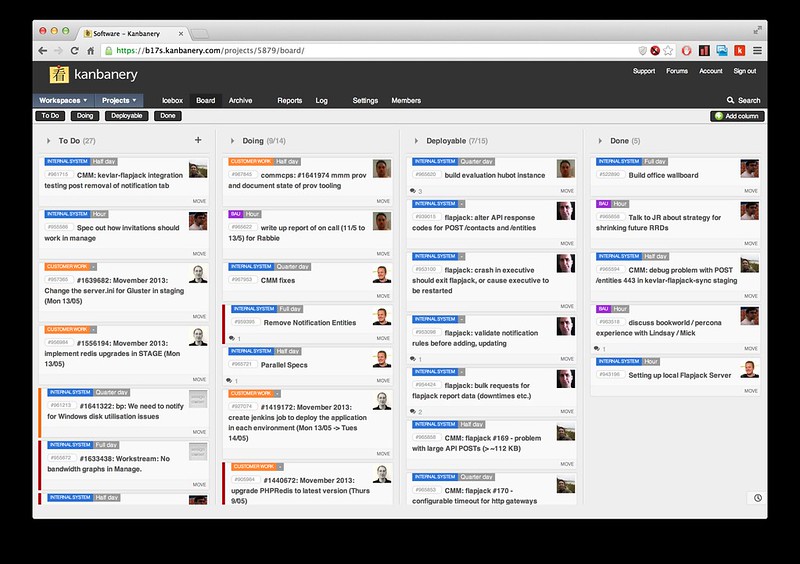
- To Do - tasks triaged, and scheduled to be worked on next
- Doing - tasks being worked on right now
- Deployable - completed tasks that need to be released to production in the near future (generally during change windows)
- Done - completed tasks
That’s only 4 - there is another stage called the Icebox. This is for tasks we’re aware of, but haven’t been triaged and aren’t scheduled to be worked on yet.
Done tasks are cleaned out once a week on Mondays, after the morning standup.
Triage is the process of taking a request and:
- Determining the business priority
- Breaking it up into smaller tasks
- (Tentatively) allocating it to someone
- Classifying the type of work (Internal, Customer, BAU)
- Estimating a task completion time
We use the board exclusively to visualise the tasks - we don’t communicate with the stakeholder through the board.
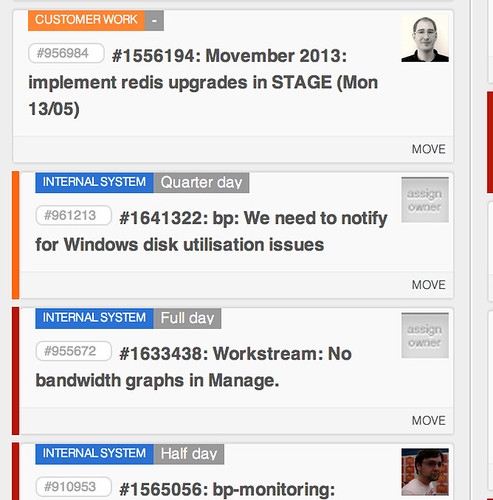
Each task has a pointer to the system the request originated from:
…and a little bit of metadata about the overall progress.
Communication with the stakeholder is done through the RT ticket / GitHub issue / email.
Limiting WIP
The WIP Limit is an artificial limit on the number of tasks the whole team can work on simultaneously. We currently calculate the WIP as:
(Number of people in Software) x 2
The goal here is to ensure no one person is ever working on more than 2 tasks at once.
I can hear you thinking “That’s crazy and will never work for me! I’m always dealing with multiple requests simultaneously”.
The key to making the WIP Limit work is that tasks are never pushed through the system - they are pulled by the people doing the work. Once you finish your current task, you pull across the next highest priority task from the To Do column.
The WIP Limit is particularly useful when coupled with visualising flow because:
- If people need to work on more than 2 things at once, it’s indicative of a bigger scheduling contention problem that needs to be solved. We are likely context switching rapidly, which rapidly reduces our delivery throughput.
- If the team is constantly working at the WIP limit, we need more people. We always aim to have at least 20% slack in the system to deal with ad-hoc tasks that bubble up throughout the day. If we’re operating at 100% capacity, we have no room to breathe, and this severely reduces our operational effectiveness.
Visualising flow
Work makes it way from left to right across the board.
This is valuable for communicating to people where their requests sit in the overall queue of work, but also in identifying bottlenecks where work isn’t getting completed.
The Kanban tool we use colour codes tasks based on how long they have been sitting in the same column:
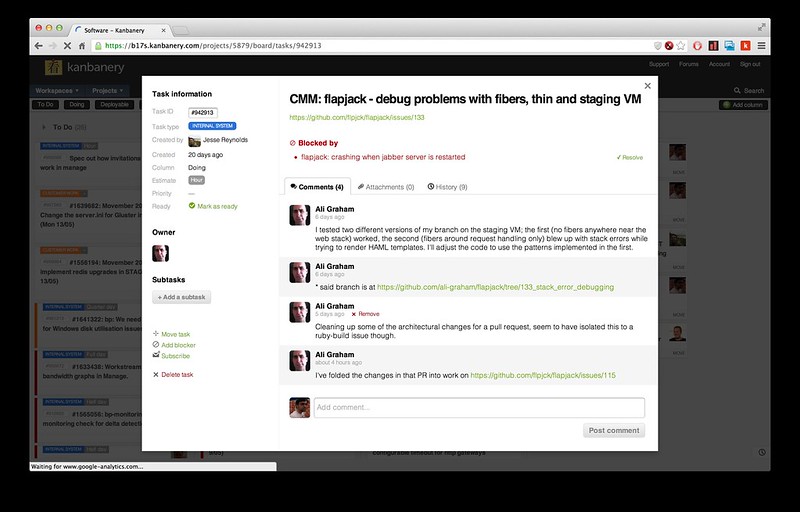
This is vital for identifying work that people are blocking on completing, and tends to be indicative of one of two things:
- Work that is too large and needs to be broken down into smaller tasks
- Work that is more complex or challenging than originally anticipated
The latter is an interesting case, because it may require pulling people off other work to help the person assigned that task push through and complete that work.
Normally as a manager this isn’t easy to discover unless you are regularly polling your people about their progress, but that behaviour is incredibly annoying to be on the receiving end of.
The board is updated in real time as people in the team do work, which means as a manager I can get out of their way and let them Get Shit Done while having a passive visual indicator of any blockers in the system.
